← back
Arduino Visualizer
arduino visualiser
recently i took part in the SoME1 math video contest, and although i didn't get a prize, the videos made for the competition were AMAZING. like all of them were so high quality.
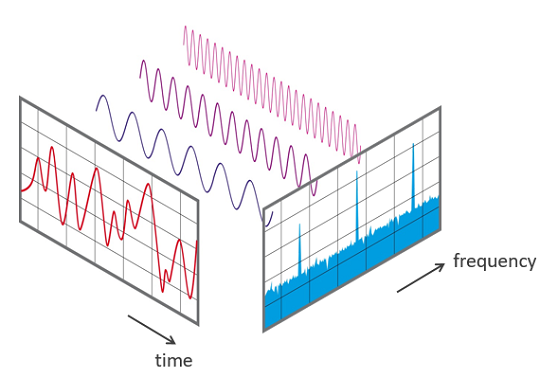
some of them were about Bezier Curves, some about Fourier Transforms, and a LOT more found here which are just utterly beautiful. in particular, i was more attracted to the fourier transform videos.
this one by Mr Water Gun and this one by Peter Gilliam were the ones that gave me a "woah" moment.
actually, i've watched 3b1b's video on the topic some time ago, and i had an idea to make an Arduino visualiser myself, to light up different colors in response to different frequencies, but i was kinda dumb back then and thought it would be easy, so eventually past me gave up ¯\(ツ)/¯
the fourier transform videos from SoME rekindled the project in my heart, and with some time to spare, i thought why not start a new side project? so i started looking into FFT algorithms, and realised that the same problem has ben solved by many people in the past, so i decided to use the arduinoFFT library for it instead.
i won't be going into how the algorithm works (definitely not because idk how it works), but there are a lot of useful resources online (SoME playlist here)
starting grounds
during my discovery, i found this blog tutorial by Norwegian Creations, which had some code to analyze frequencies from a signal generator, so i copied it over and used that as my starting point.
#include "arduinoFFT.h"

#define SAMPLES 128             //Must be a power of 2
#define SAMPLING_FREQUENCY 1000 //Hz, must be less than 10000 due to ADC

arduinoFFT FFT = arduinoFFT();

unsigned int sampling_period_us;
unsigned long microseconds;

double vReal[SAMPLES];
double vImag[SAMPLES];

void setup() {
    Serial.begin(115200);

    sampling_period_us = round(1000000*(1.0/SAMPLING_FREQUENCY));
}

void loop() {

    /*SAMPLING*/
    for(int i=0; i<SAMPLES; i++)
    {
        microseconds = micros();    //Overflows after around 70 minutes!

        vReal[i] = analogRead(0);
        vImag[i] = 0;

        while(micros() < (microseconds + sampling_period_us)){
        }
    }

    /*FFT*/
    FFT.Windowing(vReal, SAMPLES, FFT_WIN_TYP_HAMMING, FFT_FORWARD);
    FFT.Compute(vReal, vImag, SAMPLES, FFT_FORWARD);
    FFT.ComplexToMagnitude(vReal, vImag, SAMPLES);
    double peak = FFT.MajorPeak(vReal, SAMPLES, SAMPLING_FREQUENCY);

    /*PRINT RESULTS*/
    //Serial.println(peak);     //Print out what frequency is the most dominant.

    for(int i=0; i<(SAMPLES/2); i++)
    {
        /*View all these three lines in serial terminal to see which frequencies has which amplitudes*/

        //Serial.print((i * 1.0 * SAMPLING_FREQUENCY) / SAMPLES, 1);
        //Serial.print(" ");
        Serial.println(vReal[i], 1);    //View only this line in serial plotter to visualize the bins
    }

    //delay(1000);  //Repeat the process every second OR:
    while(1);       //Run code once
}
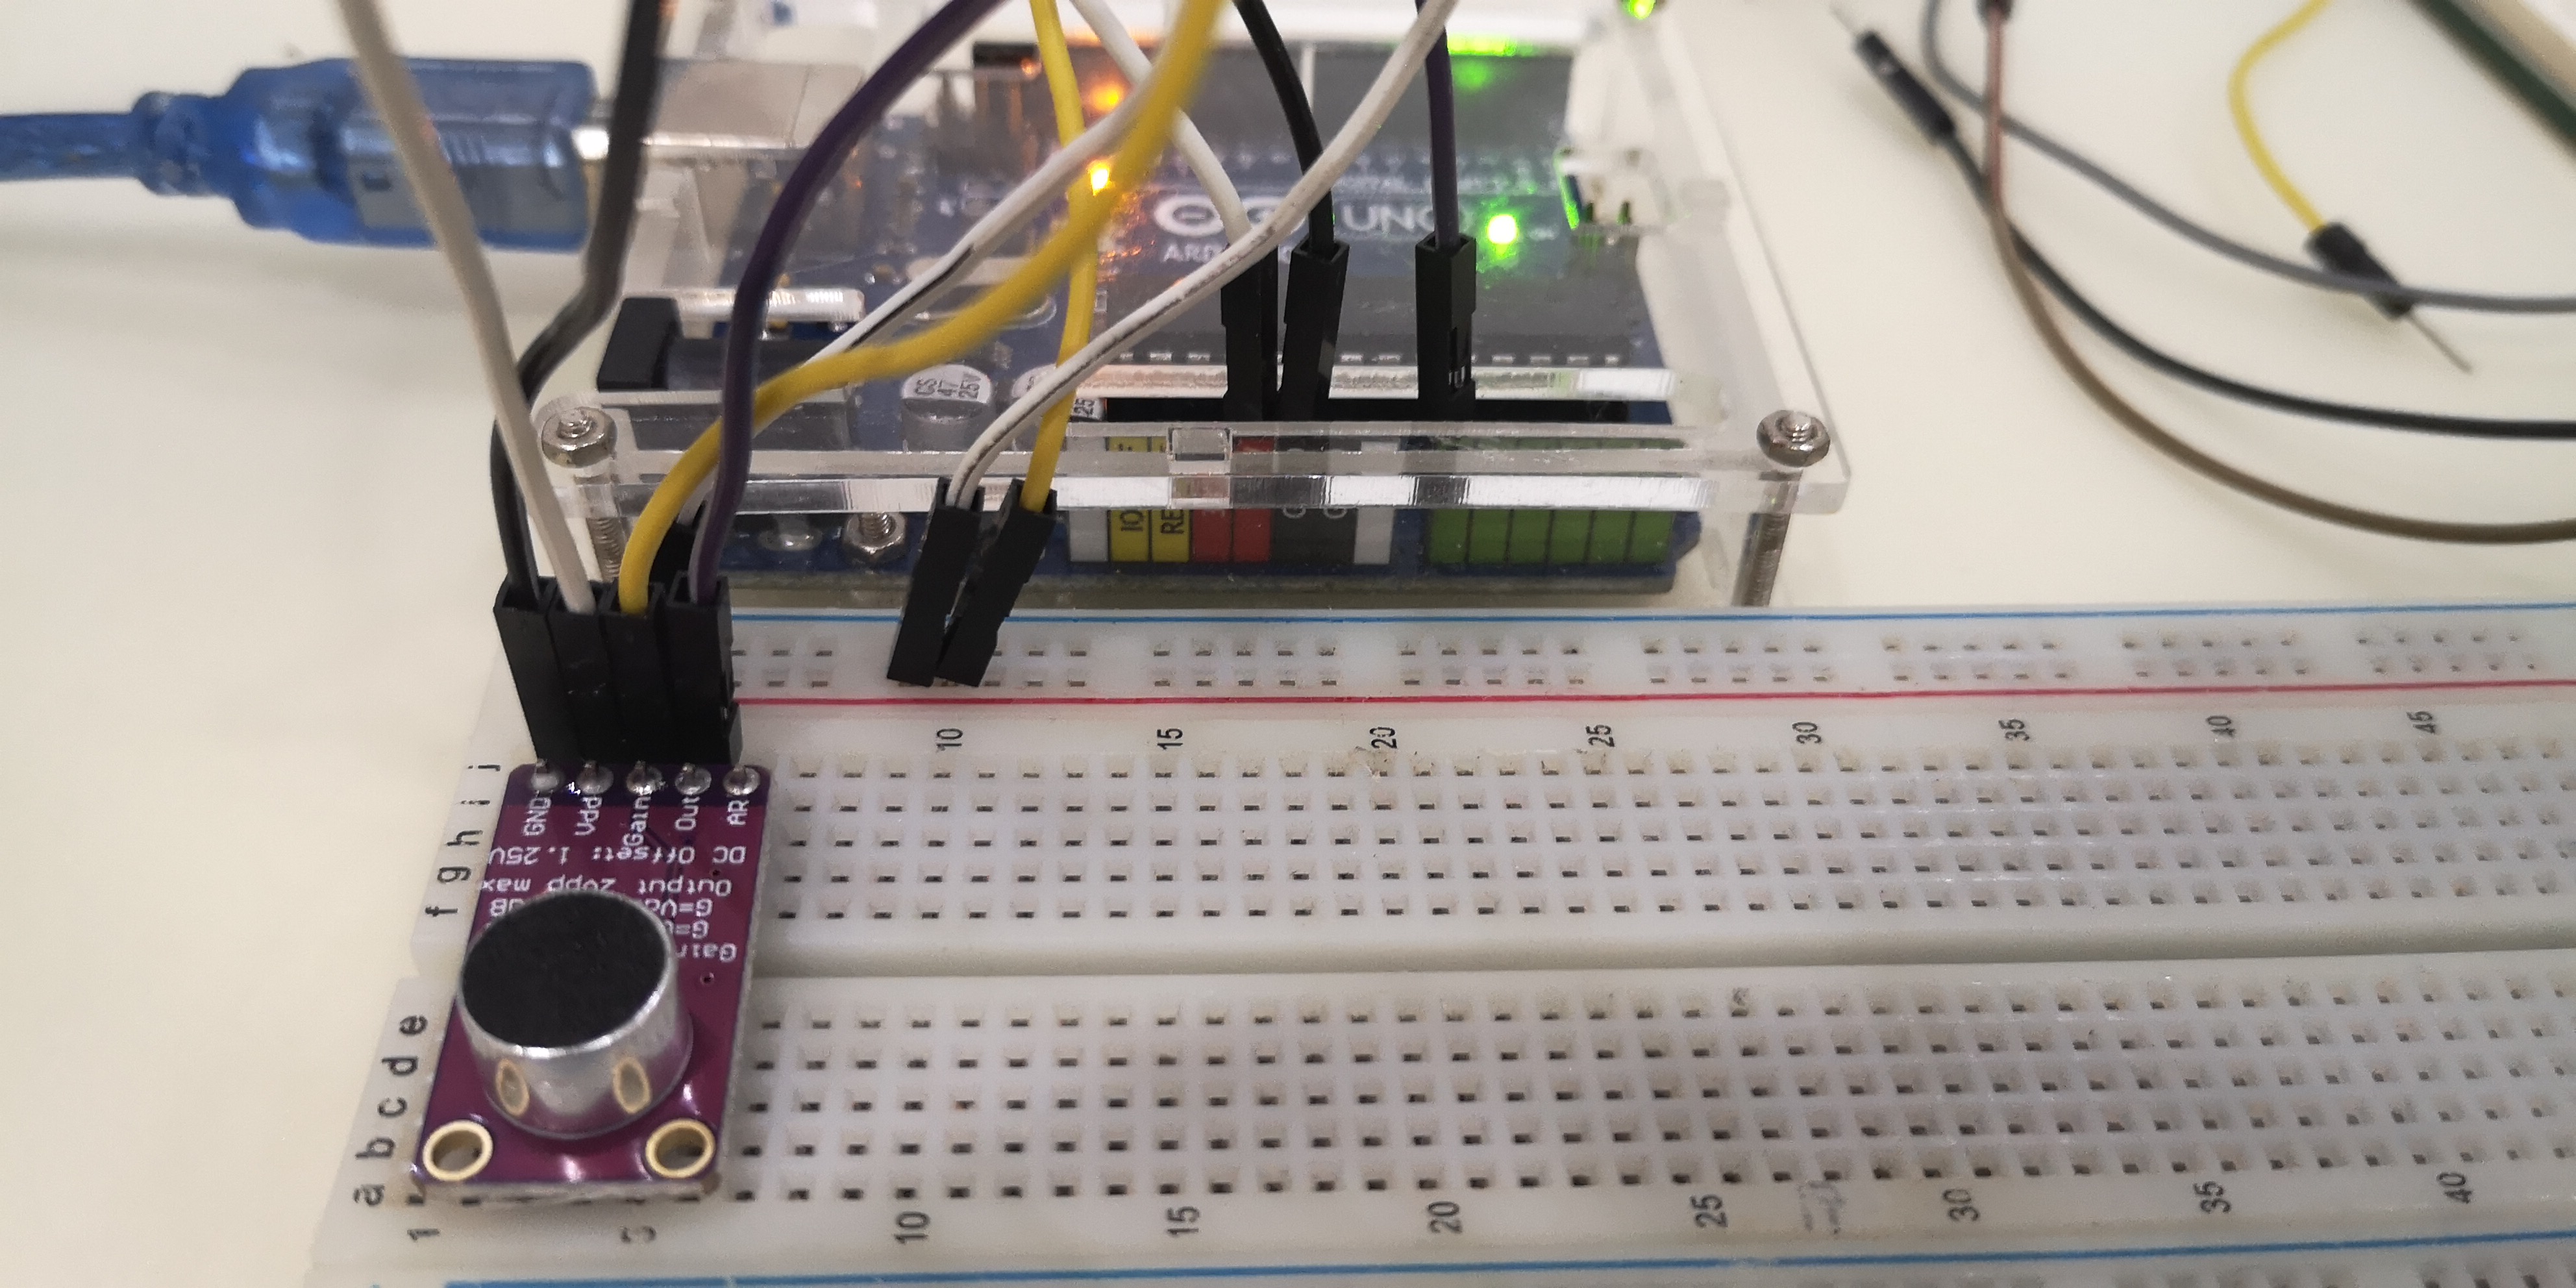
i hooked up an Arduino UNO and a MAX9814 mic module to test it out, and it worked smoothly 😎
the blog post highlights some key stuff about FFT:
- sampling frequency
- number of samples
- bins
sampling frequency
by something called the Nyquist-Shannon Sampling Theorem, to sample a signal using discrete timesteps, the sampling frequency must be at least twice the signal's frequency. basically, for each signal you want to measure, you need to be at least 2 times faster than the signal's period, in other words:
looking at the Arduino UNO, a standard analogRead function takes about - that means the time between each sampling period must be at least :
but this calculation may differ for different MCUs.
number of samples
this must be , because of the library :P
(i think) 1 sample takes around 8 bytes, but idk lol
and obviously,
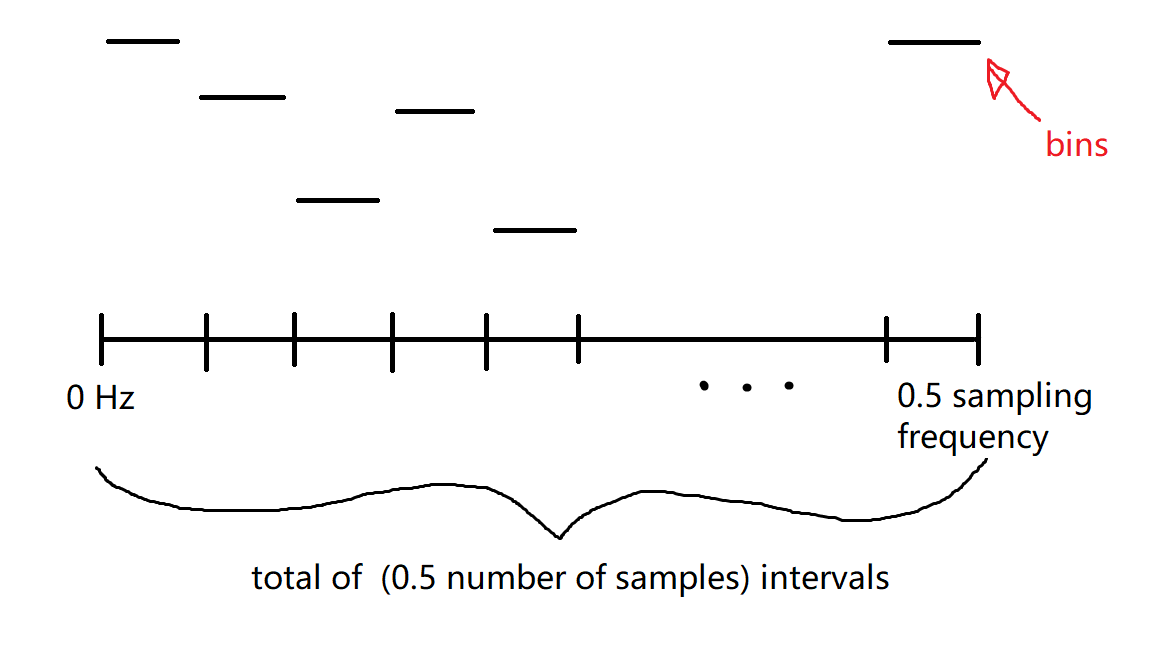
bins
bins are just the result of the FFT, and represents 1 element of the resulting array
here's a diagram explaning what each FFT outputs:
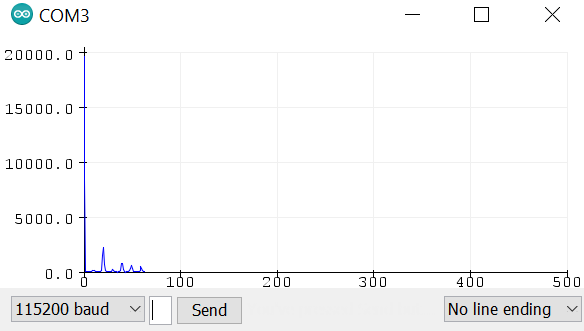 there was a huge spike around the 0th and 1st datapoint though, so i just set them equal to 0:
/*FFT*/
FFT.Windowing(vReal, SAMPLES, FFT_WIN_TYP_HAMMING, FFT_FORWARD);
FFT.Compute(vReal, vImag, SAMPLES, FFT_FORWARD);
FFT.ComplexToMagnitude(vReal, vImag, SAMPLES);
double peak = FFT.MajorPeak(vReal, SAMPLES, SAMPLING_FREQUENCY);

/*PRINT RESULTS*/
//Serial.println(peak);     //Print out what frequency is the most dominant.

vReal[0] = 0; // idk why these are here but i'll just
vReal[1] = 0; // remove these spikes for now
Norwegian Creations has another follow-up blog post too, which i recommend checking out 👀
adding a display
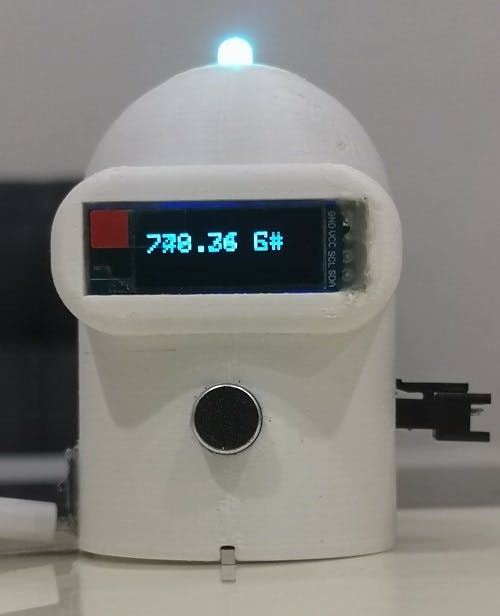
since it ran smoothly now, my next step was to attach a display to show the detected frequencies - i had a spare 128x32 OLED lying around, so i thought this was the perfect project to use it in.
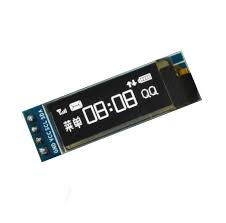
after some tinkering (copy-pasting), i got the thing to display frequencies: (i changed the samples to 64 because of memory issues + set the delay to 1ms)
// -------------------- FFT SETUP --------------------
#include "arduinoFFT.h"
#define SAMPLES 64             //Must be a power of 2
#define SAMPLING_FREQUENCY 1000 //Hz, must be less than 10000 due to ADC

arduinoFFT FFT = arduinoFFT();

unsigned int sampling_period_us;
unsigned long microseconds;

double vReal[SAMPLES];
double vImag[SAMPLES];

// -------------------- OLED --------------------
#include <SPI.h>
#include <Wire.h>
#include <Adafruit_GFX.h>
#include <Adafruit_SSD1306.h>
#define SCREEN_WIDTH 128 // OLED display width, in pixels
#define SCREEN_HEIGHT 32 // OLED display height, in pixels
#define OLED_RESET     -1 // Reset pin # (or -1 if sharing Arduino reset pin)
#define SCREEN_ADDRESS 0x3C // < See datasheet for Address; 0x3D for 128x64, 0x3C for 128x32
Adafruit_SSD1306 display(SCREEN_WIDTH, SCREEN_HEIGHT, &Wire, OLED_RESET);

char peakString[8];

void setup() {
    Serial.begin(115200);
    // SSD1306_SWITCHCAPVCC = generate display voltage from 3.3V internally
    if(!display.begin(SSD1306_SWITCHCAPVCC, SCREEN_ADDRESS)) {
      Serial.println(F("SSD1306 allocation failed"));
      for(;;); // Don't proceed, loop forever
    }

    // Clear the buffer
    display.clearDisplay();

    sampling_period_us = round(1000000*(1.0/SAMPLING_FREQUENCY));
}

void loop() {

    /*SAMPLING*/
    for(int i=0; i<SAMPLES; i++)
    {
        microseconds = micros();    //Overflows after around 70 minutes!

        vReal[i] = analogRead(0);
        vImag[i] = 0;

        while(micros() < (microseconds + sampling_period_us)){ }
    }

    /*FFT*/
    FFT.Windowing(vReal, SAMPLES, FFT_WIN_TYP_HAMMING, FFT_FORWARD);
    FFT.Compute(vReal, vImag, SAMPLES, FFT_FORWARD);
    FFT.ComplexToMagnitude(vReal, vImag, SAMPLES);
    double peak = FFT.MajorPeak(vReal, SAMPLES, SAMPLING_FREQUENCY);

    /*PRINT RESULTS*/
    //Serial.println(peak);     //Print out what frequency is the most dominant.

    vReal[0] = 0;
    vReal[1] = 0;

    for(int i=0; i<(SAMPLES/2); i++)
    {
        /*View all these three lines in serial terminal to see which frequencies has which amplitudes*/

        //Serial.print((i * 1.0 * SAMPLING_FREQUENCY) / SAMPLES, 1);
        //Serial.print(" ");
        Serial.println(vReal[i], 1);    //View only this line in serial plotter to visualize the bins
    }

    dtostrf(peak, 6, 2, peakString);
    display.clearDisplay();
    display.setCursor(10, 0);
    display.setTextSize(3);
    display.setTextColor(SSD1306_WHITE); // Draw white text
    display.write(peakString);
    display.display();

    delay(1);
    //while(1);       //Run code once
}
frequencies --> notes
now i just need to translate frequencies to notes for human readbility - i then wrote this function:
float frequencies[] { 130.8, 138.6, 146.8, 155.6, 164.8, 174.6, 185.0, 196.0, 207.7, 220.0, 232.2, 247.0 };
String notes[] { "C", "C#", "D", "D#", "E", "F", "F#", "G", "G#", "A", "A#", "B" };
int freqLength = sizeof frequencies / sizeof frequencies[0];

...

String findFrequency(float freq) {
  int closestIndex = 0;
  double diff = frequencies[closestIndex];

  for (int i=0; i<freqLength; i++) {
    diff = min(abs(frequencies[i]-freq), diff);
    if (diff == abs(frequencies[i]-freq)) {
      closestIndex = i;
    }
  }
  return notes[closestIndex];
}
it loops through an array of frequencies and their notes, and matches the current frequency to the nearest one.
connecting an RGB LED
after being able to have frequency and note data available, the next step was to make it go bling bling ✨
i connected an RGB LED (with common anode) to the arduino (pins: R=>6, G=>5, B=>3), but ironically enough i decided against mapping frequency values to the RGB color scheme.
the reason for this is because HSL is much more suited for this applciation, imo. i wanted to map the frequency range from (C to B), to a continuous color scale, and that's what HSL can provide using the color wheel.
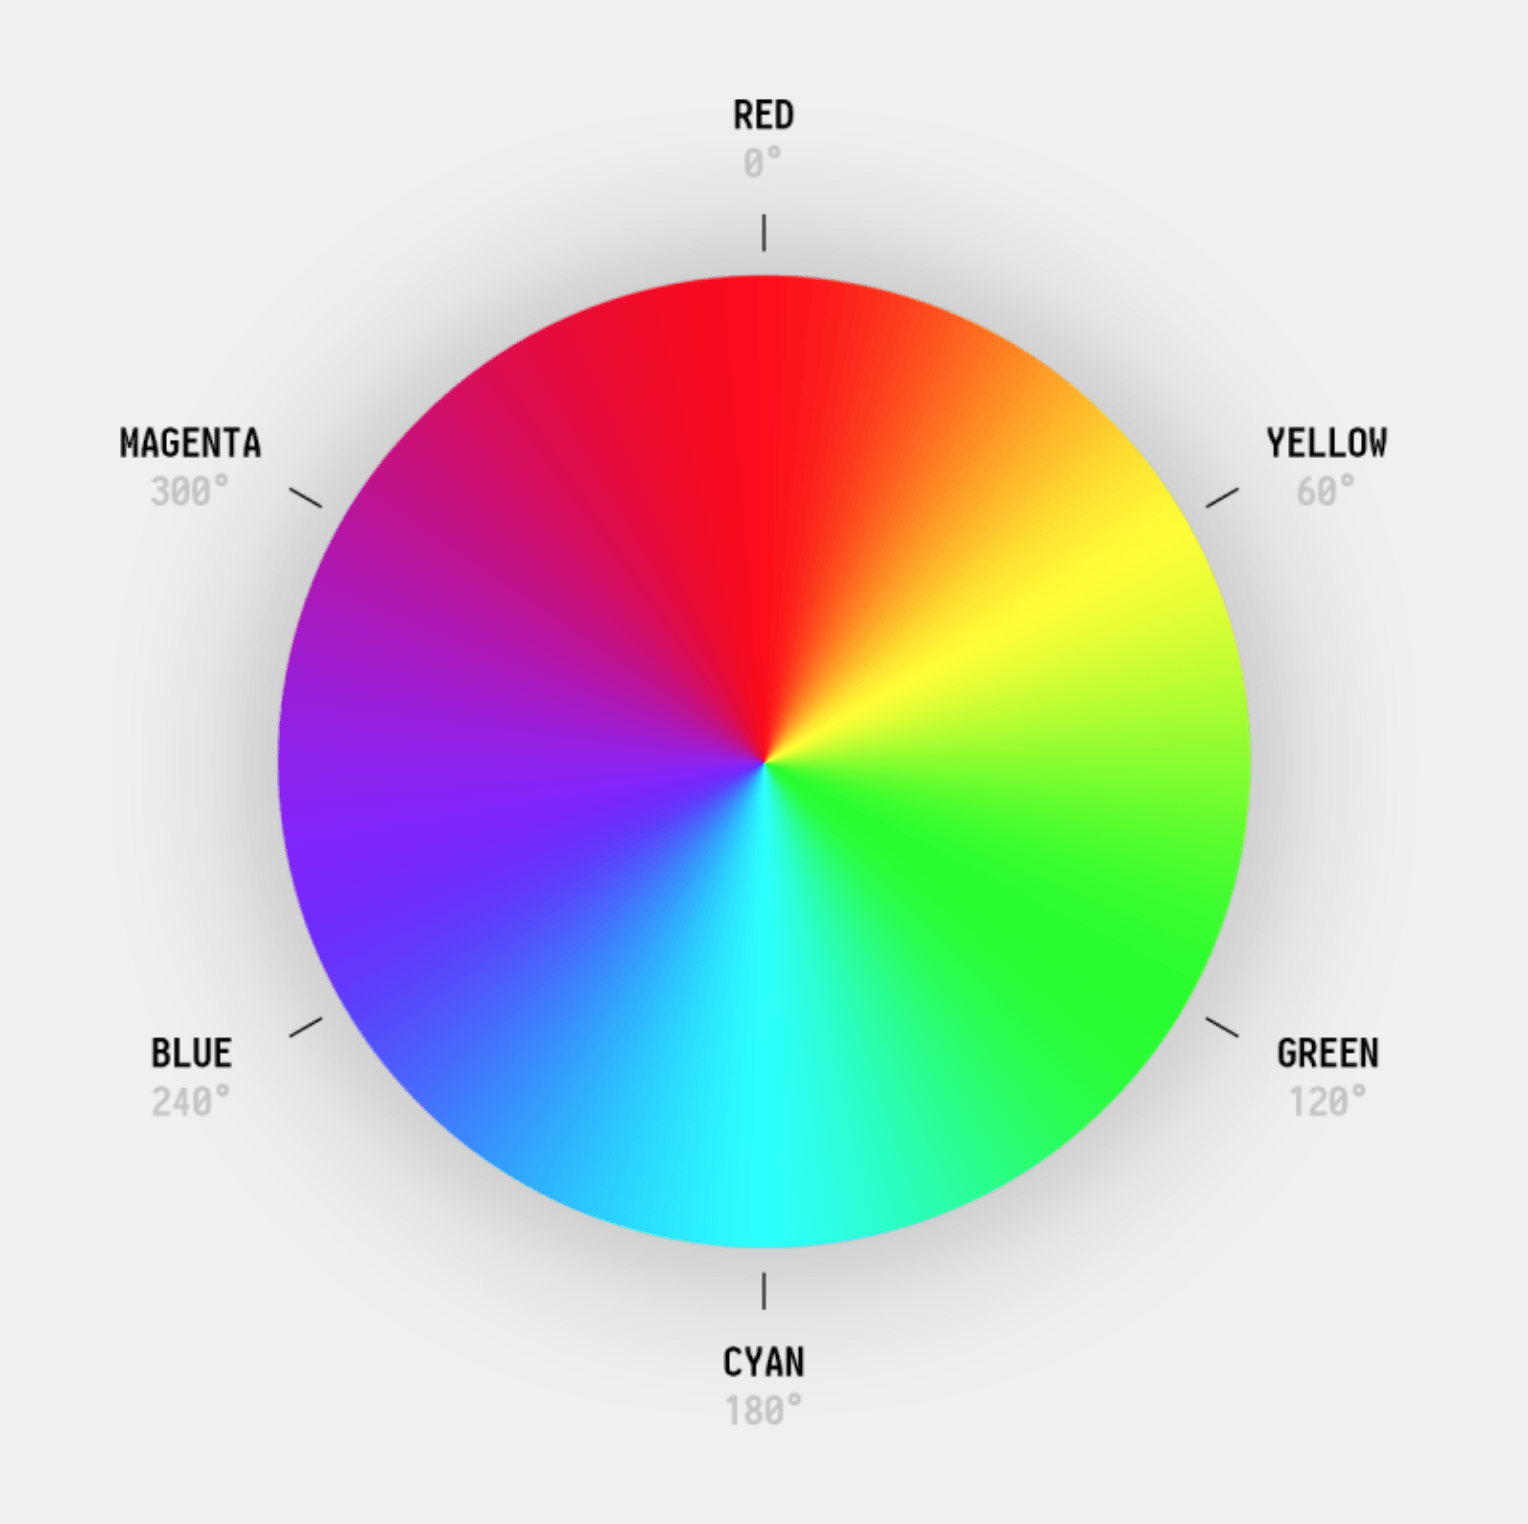
instead of changing R, G and B values independently, i could map the frequencies from 0 to 360 on the color wheel! so my idea was to map the frequencies to an HSL color, and convert it to RGB from there. i found this awesome color converting library on github, so i copied over its function and tweaked it a little, so now my code looks like:
// -------------------- FFT SETUP --------------------
#include "arduinoFFT.h"
#define SAMPLES 64             //Must be a power of 2
#define SAMPLING_FREQUENCY 1000 //Hz, must be less than 10000 due to ADC

arduinoFFT FFT = arduinoFFT();

unsigned int sampling_period_us;
unsigned long microseconds;

double vReal[SAMPLES];
double vImag[SAMPLES];


// -------------------- OLED --------------------
#include <SPI.h>
#include <Wire.h>
#include <Adafruit_GFX.h>
#include <Adafruit_SSD1306.h>
#define SCREEN_WIDTH 128 // OLED display width, in pixels
#define SCREEN_HEIGHT 32 // OLED display height, in pixels
#define OLED_RESET     -1 // Reset pin # (or -1 if sharing Arduino reset pin)
#define SCREEN_ADDRESS 0x3C // < See datasheet for Address; 0x3D for 128x64, 0x3C for 128x32
Adafruit_SSD1306 display(SCREEN_WIDTH, SCREEN_HEIGHT, &Wire, OLED_RESET);

char peakString[8];

float frequencies[] { 130.8, 138.6, 146.8, 155.6, 164.8, 174.6, 185.0, 196.0, 207.7, 220.0, 232.2, 247.0 };
String notes[] { "C", "C#", "D", "D#", "E", "F", "F#", "G", "G#", "A", "A#", "B" };
int freqLength = sizeof frequencies / sizeof frequencies[0];

// -------------------- RGB LED --------------------
#define R_PIN 6
#define G_PIN 5
#define B_PIN 3
byte color[] { 0, 0, 0 };
double h;

void setup() {
    Serial.begin(115200);

    // SSD1306_SWITCHCAPVCC = generate display voltage from 3.3V internally
    if(!display.begin(SSD1306_SWITCHCAPVCC, SCREEN_ADDRESS)) {
      Serial.println(F("SSD1306 allocation failed"));
      for(;;); // Don't proceed, loop forever
    }
    // Clear the buffer
    display.clearDisplay();

    sampling_period_us = round(1000000*(1.0/SAMPLING_FREQUENCY));

    pinMode(R_PIN, OUTPUT);
    pinMode(G_PIN, OUTPUT);
    pinMode(B_PIN, OUTPUT);
}

void loop() {

    /*SAMPLING*/
    for(int i=0; i<SAMPLES; i++)
    {
        microseconds = micros();    //Overflows after around 70 minutes!

        vReal[i] = analogRead(0);
        vImag[i] = 0;

        while(micros() < (microseconds + sampling_period_us)){ }
    }

    /*FFT*/
    FFT.Windowing(vReal, SAMPLES, FFT_WIN_TYP_HAMMING, FFT_FORWARD);
    FFT.Compute(vReal, vImag, SAMPLES, FFT_FORWARD);
    FFT.ComplexToMagnitude(vReal, vImag, SAMPLES);
    double peak = FFT.MajorPeak(vReal, SAMPLES, SAMPLING_FREQUENCY);

    /*PRINT RESULTS*/
    //Serial.println(peak);     //Print out what frequency is the most dominant.

    vReal[0] = 0;
    vReal[1] = 0;

    for(int i=0; i<(SAMPLES/2); i++)
    {
        /*View all these three lines in serial terminal to see which frequencies has which amplitudes*/
        //Serial.print((i * 1.0 * SAMPLING_FREQUENCY) / SAMPLES, 1);
        //Serial.print(" ");
        Serial.println(vReal[i], 1);    //View only this line in serial plotter to visualize the bins
    }

    dtostrf(peak, 6, 2, peakString);
    display.clearDisplay();
    display.setCursor(0, 0);
    display.setTextSize(2);
    display.setTextColor(SSD1306_WHITE); // Draw white text

    display.write(peakString);
    display.write(" ");

    // transform frequency into 3rd octave
    while (peak < frequencies[0]) peak *= 2.0;
    while (peak > frequencies[freqLength-1]) peak *= 0.5;
    display.write(findFrequency(peak).c_str());

    display.display();

    h = map(peak, frequencies[0], frequencies[freqLength-1], 0, 360);
    hslToRgb(h, 1.0, 0.5, color);

    analogWrite(R_PIN, 255-color[0]);
    analogWrite(G_PIN, 255-color[1]);
    analogWrite(B_PIN, 255-color[2]);

    delay(1);
    //while(1);       //Run code once
}

String findFrequency(float freq) {

  int closestIndex = 0;
  double diff = frequencies[closestIndex];

  for (int i=0; i<freqLength; i++) {
    diff = min(abs(frequencies[i]-freq), diff);
    if (diff == abs(frequencies[i]-freq)) {
      closestIndex = i;
    }
  }
  return notes[closestIndex];
}

double hue2rgb(double p, double q, double t) {
    if(t < 0) t += 1;
    if(t > 1) t -= 1;
    if(t < 1/6.0) return p + (q - p) * 6 * t;
    if(t < 1/2.0) return q;
    if(t < 2/3.0) return p + (q - p) * (2/3.0 - t) * 6;
    return p;
}

void hslToRgb(double h, double s, double l, byte rgb[]) {
    double r, g, b;
    h /= 360;

    if (s == 0) {
        r = g = b = l; // achromatic
    } else {
        double q = l < 0.5 ? l * (1 + s) : l + s - l * s;
        double p = 2 * l - q;
        r = hue2rgb(p, q, h + 1/3.0);
        g = hue2rgb(p, q, h);
        b = hue2rgb(p, q, h - 1/3.0);
    }

    rgb[0] = r * 255;
    rgb[1] = g * 255;
    rgb[2] = b * 255;
}
adding more stuff
the project's almost done now - but i think there was room for improvement.
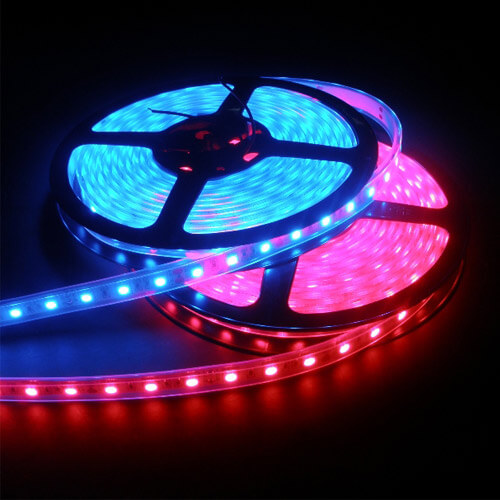
although one RGB LED is easy to work with, but maybe not the prettiest 👀 because I had a WS2812B LED strip lying around, i decided to use that in addition to the RGB LED. i won't talk about how i programmed them though, but the code would be availlable on my github :3
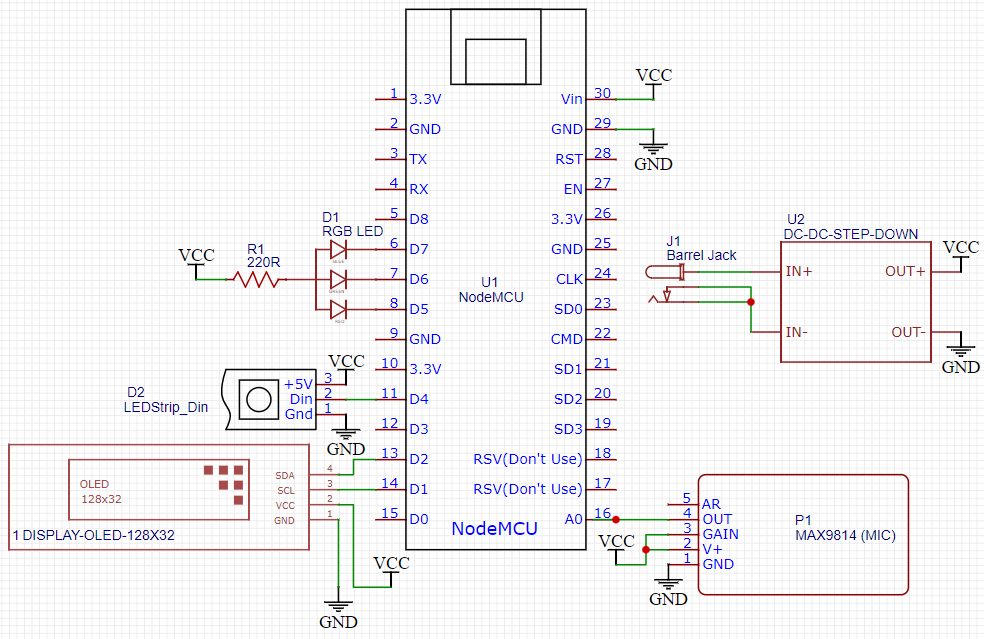
i also wanted the project to be portable, like a mini lamp - so i had to add a power source too. i went with a micro USB port and a barrel jack, connected to a 5V DC-DC stepdown to provide stable 5V to the project.
the final schematic looked like this:
the enclosure
so it works now but it looks terrible!!! everything just lives on my breadboard.
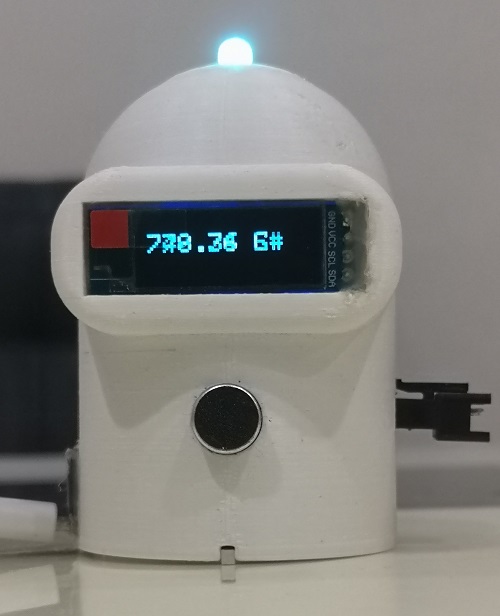
after some thought, i decided to go with a sussy crewmate model, because why not - the LED would pop up on its head and an OLED on its glasses would display which frequency it's currently hearing.
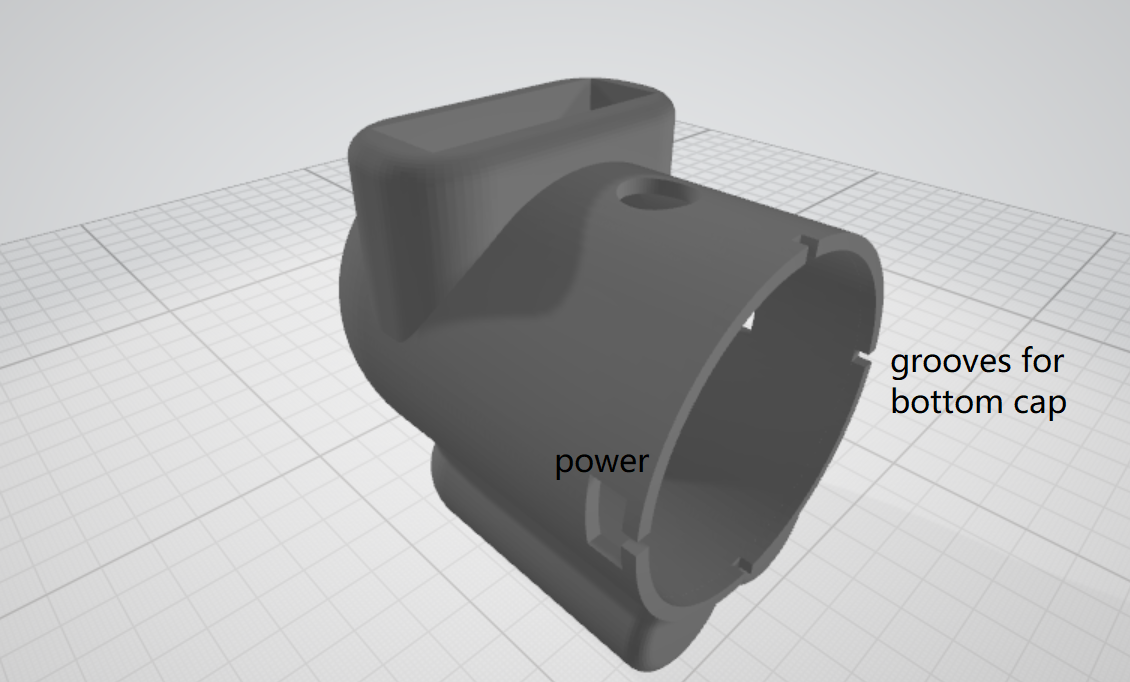
i came up with this 3d model to be printed:
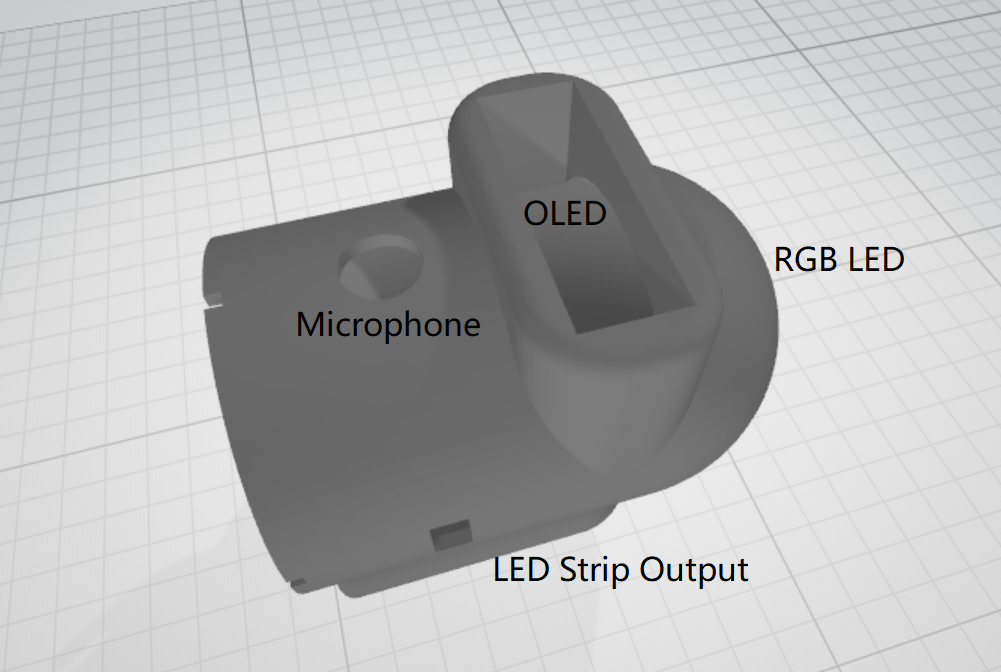
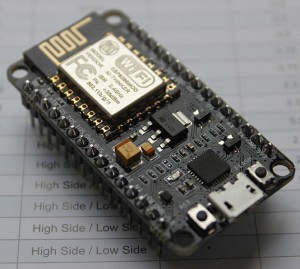
unfortunately i had to switch to a smaller microcontroller, because the UNO could not fit in this enclosure. i settled on a NodeMCU, because not only is it smaller but also has better specs too (80MHz clock speed, ~80kb) compared to the Arduino UNO (16MHz, ~2kb)
the assembly
in theory, i would have just soldered everything using wires and fitted them nicely into the enclosure, and the project would have been completed.
but i was too naive 😭
i realised i had the power hole too small, and I had to sand it down to make the opening bigger so i could put both the microusb and barrel jack together.
also, due to my lack of forseeing the actual project assembly, it was very hard to fit the project together - the body was one rigid shell, and getting all the components in all of their right places took a lot of patience and sanity from me.
not only that, when i was soldering the project together, i cut some corners and used very short wires. don't be like me. use longer wires. you'll thank yourself later.
and my last shortcoming was my stupidity. i thought i didn't need mounting holes because hot glue would do the trick, but it didn't work out the way i expected it. the OLED display was stressful to attach with hot glue, and so were the barrel jack and micro usb.
nevertheless, i overcame all these difficulties in the end. it took about an afternoon of soldering and hot glueing, and i was satisfied with how it turned out:
this is how it looks inside:
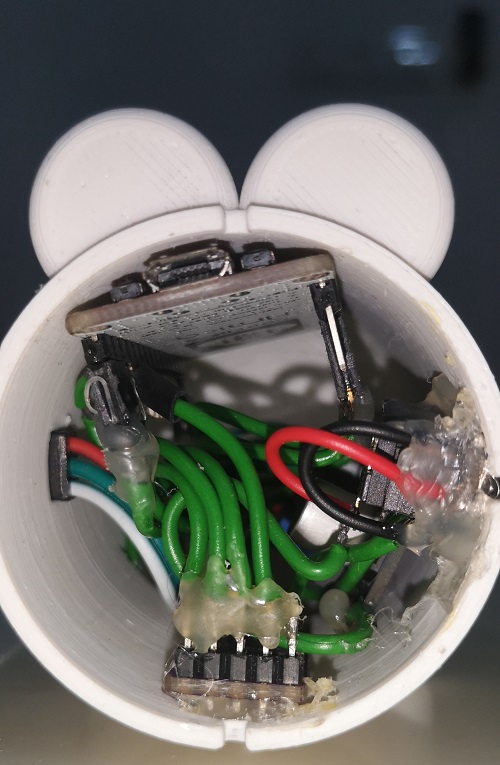 (yes, its atrocious i know)
demo gif:
footnote
even though it wasn't perfect, i learned a lot while making this project. after all, nothing's perfect anyways 😎
things i've learned
- think every detail through (yes it looks good, but is it a practical thing to add/remove?)
- add mounting holes next time
- once you have an idea, don't sit on it for too long or you'll forget about it and lose novelty
the code / edited 3d model can be found over at my github: https://github.com/Fogeinator/sussy-lamp
i'll keep updating the code though. i'll be adding more LED strip patterns, and since im using nodemcu, i'll add OTA support too. (OTA = over the air, basically wireless code uploading)
anyways, this was my first devlog blog post. it's not meant to be a guide for those who want to build along, but rather a personal diary so i can reflect back on my dumbness in the future.
should i write a tutorial blog post for people who actually want to build this project? what would you like to see next? let me know on discord/twitter/anywhere I am! i would love to hear any feeedback :3
that's all for now, thanks for reading! 💖